Oil and Gas News: Turkeys’ role in renewables, Gulf Coast refineries reach pre-Harvey levels
Poultry excrement could replace coal as renewable energy source
A new study shows that turkey excrement may have a future as a fuel for heat and electricity, according to a new study by Ben-Gurion University of the Negev (BGU) researchers. Treated excrement from turkeys, chickens and other poultry, when converted to combustible solid biomass fuel, could replace approximately 10 percent of coal used in electricity generation, reducing greenhouse gases and providing an alternative energy source.
While biomass accounts for 73 percent of renewable energy production worldwide, crops grown for energy production burden land, water and fertilizer resources. According to the researchers, "Environmentally safe disposal of poultry excrement has become a significant problem. Converting poultry waste to solid fuel, a less resource-intensive, renewable energy source is an environmentally superior alternative that also reduces reliance on fossil fuels." According to the study in Elsevier’s Applied Energy, researchers at the Zuckerberg Institute for Water Research at BGU evaluated two biofuel types to determine which is the more efficient poultry waste solid fuel.
The production, combustion and gas emissions of biochar, which is produced by slow heating of the biomass at a temperature of 450°C (842°F) in an oxygen-free furnace with hydrochar were compared. Hydrochar is produced by heating wet biomass to a much lower temperature of up to 250°C under pressure using a process called hydrothermal carbonization (HTC). HTC is mimics natural coal formation within several hours. The study was funded by the Israeli Ministry of Environmental Protection, the Rosenzweig-Coopersmith Foundation.
Global LNG trade moves through the South China Sea
The South China Sea is a major route for liquefied natural gas (LNG) trade, and in 2016, almost 40 percent of global LNG trade, or about 4.7 trillion cubic feet (Tcf), passed through the South China Sea. More than two-thirds of China’s LNG imports and more than 90 percent of Taiwan’s LNG imports passed through the South China Sea in 2016. Total imports of LNG to China have more than doubled over the previous five years, from 0.56 Tcf in 2011 to 1.20 Tcf in 2016. However, more than half of the growth in China’s LNG imports were volumes that went to northern ports without transiting the South China Sea. Based on projections in the International Energy Outlook 2017, the EIA projects that China will surpass South Korea as the world’s second-largest LNG importer by 2018 and nearly match Japan’s level of LNG imports by 2040.
Graphic courtesy of EIA
Growth in global energy-related CO2 emissions expected to slow
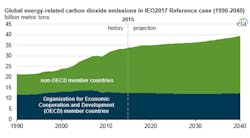
The Environment Information Association (EIA) projects that growth in global carbon dioxide (CO2) emissions from energy-related sources will slow despite increasing energy consumption. The EIA’s International Energy Outlook 2017 Reference case projects that energy-related CO2 emissions will grow 0.6 percent per year from 2015 to 2040, a slower rate of growth than the 1.8 percent per year experienced from 1990 to 2015. Emissions from countries outside the Organization for Economic Cooperation and Development (OECD) account for all of EIA’s projected growth in energy-related CO2 emissions. Energy-related CO2 emissions from non-OECD countries exceeded those from the OECD countries in 2005. The International Energy Outlook 2017 Reference case projects that energy-related CO2 emissions from non-OECD countries will grow 0.9 percent per year from 2015 to 2040, which is much lower than the 3.2 percent per year average growth rate from 1990 to 2015.
Graphic courtesy of EIA
September unplanned global oil supply disruptions fall to lowest level
Unplanned global supply disruptions fell to 1.6 million barrels per day (b/d) in September, the lowest level since January 2012. Over the past six months, unplanned oil supply disruptions have fallen by more than 1.0 million b/d, as outages in Libya, Nigeria and Iraq abated. In addition, Canada’s disrupted supplies, which reached their peak in April 2017 at 425,000 b/d, returned to production in August 2017. U.S. production also saw shut-ins this summer because of Hurricane Harvey, which led to a 186,000 b/d disruption in August. This disruption had lessened to an average of 53,000 b/d in September. Hurricanes Irma and Maria did not affect U.S. crude oil production.
China leads the growth in projected global natural gas consumption
Global natural gas consumption is expected to grow from 340 billion cubic feet per day (Bcf/d) in 2015 to 485 Bcf/d by 2040, primarily in countries in Asia and in the Middle East, based on projections in EIA’s latest International Energy Outlook 2017 (IEO2017). China accounts for more than a quarter of all global natural gas consumption growth between 2015 and 2040. The projected growth in natural gas consumption in China is driven by environmental policies, relative cost competiveness of natural gas in the industrial and transportation sectors, and relatively high economic growth. China’s pipeline imports increased to 3.7 Bcf/d in 2016, accounting for 19 percent of the total natural gas supply. Although the IEO2017 Reference Case expects China’s imports of natural gas by pipeline to rise in absolute terms to 7.3 Bcf/d in 2040, their share of China’s total supply is projected to fall to 12 percent by that year. China began importing natural gas by pipeline from Turkmenistan in 2010 and has since begun importing natural gas from Uzbekistan, Kazakhstan, and Myanmar. EIA expects natural gas imports from Russia on the new 3.7 Bcf/d Power of Siberia pipeline to begin in late 2019.
Image courtesy of EIA
Gulf Coast refinery runs approach levels seen prior to Hurricane Harvey
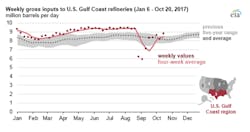
For the week ending Oct. 20, gross inputs to petroleum refineries in the U.S. Gulf Coast averaged 8.8 million barrels per day (b/d), or about 324,000 b/d higher than the previous five-year range for mid-October, based on data in the EIA’s Weekly Petroleum Status Report (WPSR). Gross inputs, also referred to as refinery runs, in the Gulf Coast had been higher than the five-year range for much of 2017 until Hurricane Harvey made landfall in the Houston, Texas, area on Aug. 25. After several weeks of increasing refinery runs following Hurricane Harvey in late September and early October 2017, Gulf Coast refinery runs fell again during the week ending October 13 because of additional disruptions caused by Hurricane Nate. Overall, the magnitude and duration of Hurricane Harvey’s impact on Gulf Coast refinery runs has been similar to what happened following Hurricanes Katrina in 2005 and Gustav and Ike in 2008.
Image courtesy of EIA
FERC regains ability to certificate natural gas pipelines
Five new pipeline projects in the Northeast received approval from the Federal Energy Regulatory Commission (FERC) in October, some of the first projects to be approved since February. Before losing its quorum on Feb. 3, 2017, FERC had certificated more than 7 Bcf/d of pipeline capacity. Since then, as of Oct. 24, 2017, 12 pre-filing applications have been submitted to FERC for pipeline projects transmitting natural gas in the U.S. and 46 pipeline projects have FERC applications in process. The capacity of all these projects totals about 40 Bcf/d, covering slightly more than 2,500 miles of both new and upgraded pipeline construction. In comparison, the lower 48 states have more than 300,000 miles of interstate and intrastate natural gas transmission pipeline in use. In addition, the proposed Cheniere Midship Pipeline in Oklahoma is a 199-mile pipeline, with a capacity of 1.4 Bcf/d, that would connect to pipelines that support Cheniere’s export facilities and provide natural gas to consumers along the Gulf Coast.
Graphic courtesy of EIA
Widening Brent-WTI price spread unlikely to change East Coast crude oil supply
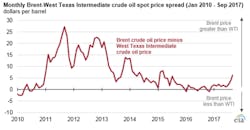
In September and October 2017, the difference between domestic and foreign crude oil prices has risen to the highest level since 2015. In the past, price differences between West Texas Intermediate (WTI) and Brent crude oil led to changes in crude oil supply for petroleum refineries in the U.S. East Coast region. In December 2015, restrictions on exporting domestic crude oil were removed, so East Coast refiners must now compete with international buyers for domestic crude oil, and pay the typically higher coastwise-compliant shipping rates for a U.S. Gulf Coast-to-U.S. East Coast tanker shipment. U.S. East Coast refiners are unlikely to repeat shifts in crude oil supply patterns despite the widening price difference. Find additional information about factors that affect East Coast crude oil supply — and how those factors differ from those present in 2011 through 2013 — here.
Graphic courtesy of EIA
US distillate production exported
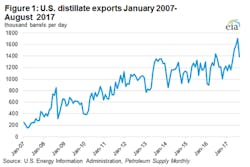
U.S. distillate exports have continued to increase significantly over the first part of 2017, setting record highs for three consecutive months from May through July (Figure 1) before declining in August (at least partially as the result of hurricane activity). At the same time, U.S. distillate demand was relatively stable, increasing only slightly from January through July 2017 compared with 2016 levels. Although January through July 2017 average exports of distillate to Europe fell compared with the same period in 2016, U.S. refineries in the Gulf Coast are geographically well positioned to export to Mexico and to countries in Central and South America, and distillate exports to these locations increased. In addition to increased export demand, high distillate crack spreads (the difference between distillate prices and crude oil prices) encouraged refinery runs. During this period, overall demand outpaced production and inventories fell.
Graphic courtesy of EIA
Infrastructure activities increase as Pennsylvania’s natural gas production reaches new highs
Pennsylvania’s natural gas production reached a new high of 15 billion cubic feet per day (Bcf/d) in October 2017, an increase of 25 percent from year-ago levels and an increase of 80 percent from January 2013. Pennsylvania accounts for 19 percent of total U.S. natural gas production. This production is largely from Appalachia’s Marcellus shale formation, 76 percent of which currently comes from Pennsylvania. The Marcellus formation is primarily located in Pennsylvania, West Virginia, and New York. Pennsylvania is seeing an increase in permitting and drilling activity as new pipelines come online capable of moving natural gas to market centers outside of the region. The Pennsylvania Department of Environmental Protection issued 1,371 natural gas drilling permits in 2016, but so far in 2017 it has already issued 1,447 permits. During 2016, the daily rig count averaged 20 rigs in Pennsylvania. So far in 2017, the average daily rig count in Pennsylvania is 33 rigs, based on data from Baker Hughes.
Graphic courtesy of EIA
ETF affect market liquidity & price
Exchange-traded funds (ETF) play an increasing role in oil futures markets. Although ETFs are relatively new, their increased positions of oil futures contracts in recent years may have, at times, affected market liquidity and price volatility. ETFs allow smaller capitalized investors indirect access to the oil futures market. Their growth has likely contributed to the increased volume in crude oil futures trading and the number of outstanding contracts (open interest), but the effects on price direction are unclear. In a futures market, a long position means the holder bought futures contracts, whereas a short position means the holder sold futures contracts. Total long contracts must equal total short contracts because every buyer must have a seller. Most market participants do not settle their contracts with physical delivery of crude oil, rather they buy or sell futures before the contract expires to offset their initial positions.
Natural gas stocks end refill season just below the five-year average
Working natural gas in storage in the lower 48 states as of Oct. 31, 2017 totaled 3,784 billion cubic feet (Bcf), as interpolated from EIA’s Weekly Natural Gas Storage Report data released November 9. The natural gas storage injection season has been traditionally defined as April 1 through October 31, although injections often occur into November. Inventories at the traditional end of this year’s injection season were 58 Bcf (2 percent) lower than the five-year (2012–16) end-of-October average and 193 Bcf (5 percent) lower than the record-setting level of 3,977 established last year.
CO2 emissions from coal fell by record amount in 2015
CO2 emissions associated with coal consumption in the U.S. fell by a record 231 million metric tons in 2015. More than 60 percent of the annual decrease occurred in 10 states, led by Texas, Indiana, Ohio, Illinois, and Pennsylvania, according to EIA’s state-level carbon dioxide emissions data. Most of the decline in 2015 U.S. coal consumption occurred in the electric power sector, where reduced coal-fired electricity generation was largely offset by higher natural gas-fired electricity generation. Energy-related CO2 emissions from natural gas surpassed those from coal for the first time in 2015, totaling 1,482 million metric tons compared with coal’s 1,467 million metric tons. However, because natural gas is less carbon intensive than coal, about 80 percent more energy was provided by the natural gas (28.2 quadrillion British thermal units) consumed in 2015, compared with coal (15.5 quadrillion British thermal units).
Graphic courtesy of EIA
Russia exports most of its crude oil production
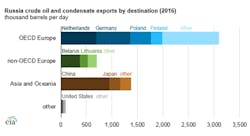
Russia exported more than 5.2 million barrels per day (b/d) of crude oil and condensate and more than 2.4 million b/d of petroleum products in 2016, mostly to countries in Europe. Exports of crude oil and petroleum products represented nearly 70 percent of total Russian petroleum liquids production in 2016. Russia’s oil and natural gas industry is a key component of Russia’s economy, with revenues from oil and natural gas activities—including exports—making up 36 percent of Russia’s federal budget revenues. Russia also exports sizeable volumes of petroleum products. According to Eastern Bloc Energy, Russia exported about 1.3 million b/d of fuel oil, 990,000 b/d of diesel, and 120,000 b/d of gasoline in 2016. It exported smaller volumes of liquefied petroleum gas (75,000 b/d) during the same year, according to Clipper Data. Product exports have grown significantly over the past several years and are expected to continue to grow as Russian refineries add capacity to produce more high-quality products.
Graphic courtesy of EIA
US natural gas projects expected to be completed over winter
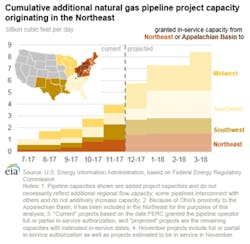
Several natural gas pipeline projects in the Northeast U.S. are expected to be completed over this coming winter, with more than half of the capacity designed to transport natural gas from the Northeastern Appalachian production region to Midwest and Southeast markets. Between December 2017 and March 2018, 2.6 billion cubic feet per day (Bcf/d) and 1.4 Bcf/d of additional capacity is expected to be in service from the Northeast to the Midwest and from the Northeast to the Southeast, respectively. EIA’s November Drilling Productivity Report estimates November-to-December production to increase in the Appalachian region—where more than 40 percent of onshore U.S. natural gas production now occurs—by 394 million cubic feet per day (MMcf/d) or more than double the increase in any other production region. This increase follows a similar October-to-November increase of 398 MMcf/d.

