Oil and Gas News: US leads world in petroleum, natural gas production
US leads world as top petroleum and natural gas hydrocarbon producer
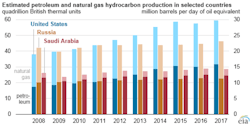
U.S. petroleum and natural gas hydrocarbon production reached a record high in 2017, noted the U.S. Energy Information Administration (EIA). The U.S. has led the world in natural gas production since 2009 when it surpassed Russia. In 2013, the U.S. became the top producer of petroleum hydrocarbons when it surpasses Saudi Arabia. U.S. petroleum and natural gas production has increased by nearly 60 percent since 2008.
A 21-percent increase in oil prices to approximately $65 per barrel drove petroleum production to a 745,000-barrel-per-day (b/d increase in 2017. Crude oil and lease condensate accounted for 60 percent of total U.S. petroleum hydrocarbon production in 2017, and natural gas plant liquids accounted for 24 percent.
Dry natural gas production increased during the last nine months of 2017, leading to a 5.7-billion-cubic-feet (Bcf/d) difference between the first quarter and fourth quarter of 2017.
Graphic courtesy of EIA
Northeast US to achieve record natural gas pipeline capacity
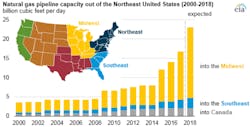
The EIA predicts construction of new natural gas pipeline capacity in the U.S. will continue in 2018, especially in the northeastern U.S. If all projects come online by their scheduled service dates, more than 23 Bcf/d of takeaway capacity will be online out of the Northeast at the end of 2018, up from an estimated 16.7 Bcf/d at the end of 2017 and more than three times the takeaway capacity than at the end of 2014.
Most of the projects scheduled to be in service by the end of 2018 are associated with four major interstate pipelines: Columbia Pipeline Group (TCO), which includes Columbia Gas and Columbia Gulf Transmission; Transcontinental Gas Pipeline (Transco); Rover Pipeline; and NEXUS Pipeline.
Graphic courtesy of EIA
Gulf Coast port limitation impose costs on rising crude oil exports
Despite the fact that U.S. Gulf Coast onshore ports cannot fully load Very Large Crude Carriers (VLCC), U.S. crude oil exports averaged 1.1 million b/d in 2017 and 1.6 million b/d so far in 2018, up from less than 0.5 million b/d in 2016.
Each VLCC is designed to carry approximately 2 million barrels of crude oil. VLCCs large sizes require ports with waterways of sufficient width and depth for safe navigation.
To circumvent depth restrictions, VLCCs that transport crude oil to or from the U.S. Gulf Coast typically use partial loadings and ship-to-ship transfers, which can be costly. Since exports to Asia are a growing share of total U.S. crude oil exports, these costs will become more important.
US sends most propane exports to Asia
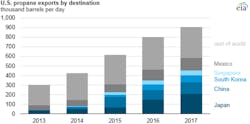
In 2017, the U.S. exported 905,000 b/d of propane, with the largest volumes going to supply petrochemical feedstock demand in Asian countries. Asian countries — Japan, China, South Korea and Singapore — account for four of the top five countries that receive U.S. propane exports. Collectively these four countries imported 452,000 b/d of U.S. propane in 2017, or approximately half of total U.S. propane exports. Propane accounted for 17 percent of all U.S. petroleum product exports in 2017.
When U.S. propane exports to these countries doubled between 2015 and 2017, some of the region’s propane supplies from the Middle East as well as regional production of propane from refineries and natural gas processing plants were displaced. Between 2010 — when the U.S. became a net exporter of propane — and 2017, gross propane exports increased by 796,000 b/d. By late 2017, propane prices re-established a closer link with international propane and crude oil markets.
Graphic courtesy of EIA
EIA forecasts crude oil, gasoline price increase for 2018
The EIA’s May Short-Term Energy Outlook (STEO) forecasts that Brent crude oil prices will average $71 per barrel (b) in 2018, $7/b higher than April’s STEO. The agency expects regular gasoline retail prices to increase to an average of $2.79/gallon (g) in 2018, $0.15/g higher than in April’s STEO. Monthly average Brent crude oil spot prices have increased in nine of the past 10 months, most recently averaging $72/b in April.
The EIA reported that an increase in crude oil prices is likely driven by three factors: "falling global oil inventories, heightened market perceptions of geopolitical risks, and strong global economic growth signals."
US liquid fuels inventories rebalance ahead of OPEC meeting
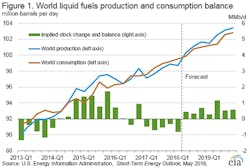
Global markets appear more balanced after the extended period of oversupply in global petroleum markets that began before the Organization of the Petroleum Exporting Countries (OPEC) decided to cut production. The large buildup of global inventories during that period has now been drawn down, but uncertainty remains going forward, reported the EIA. OPEC will reconvene on June 22.
Quarterly global liquid inventories experienced sustained increases from mid-2014 through most of 2016, but declined throughout 2017 and into the first quarter of 2018. From January 2017 to April 2018, U.S. crude oil and other liquids inventories decreased by 162 million barrels while Organization for Economic Cooperation and Development (OECD) inventories decreased by 234 million barrels. Over this same period, U.S. and OECD crude oil and other liquids inventories moved higher than their five-year averages.
The EIA forecasts that the tightening trend in global petroleum markets will reverse. In the May 2018 STEO, the EIA predicts that U.S. and OECD petroleum and other liquids inventories will return to surplus levels compared with their five-year averages, although on a smaller scale compared with the period between 2015 and 2016.
Graphic courtesy of EIA
US diesel price increases
The U.S. average regular gasoline retail price for May 14 was $2.87 per gallon. However, because of the Motor Gasoline Price Survey implemented on May 14, the published price estimates from May 14 are not directly comparable with those published for May 7, which were based on the EIA’s previous sample. The U.S. average diesel fuel price increased nearly 7 cents to $3.24 per gallon on May 14, nearly 70 cents higher than one year ago.
Propane/propylene inventories rise
As of May 11, U.S. propane/propylene stocks had increased by 1.7 million barrels to 40.4 million barrels, 12.3 million barrels (23.4 percent) lower than the five-year average inventory level for this same time of year, said the EIA. Midwest, East Coast and Gulf Coast inventories increased by 0.8 million barrels, 0.6 million barrels and 0.4 million barrels, respectively, while Rocky Mountain/West Coast inventories decreased by 0.1 million barrels. Propylene non-fuel-use inventories represented 7.2 percent of the total propane/propylene inventories.
Solar becomes third largest renewable electricity source
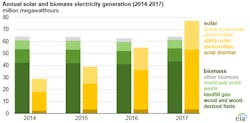
U.S. solar electricity generation reached 77 million megawatthours (MWh) in 2017, surpassing generation from biomass resources, which generated 64 million MWh in 2017. Among renewable sources, only hydro and wind generated more electricity in 2017, at 300 million MWh and 254 million MWh, respectively. In recent years, solar generating capacity has consistently grown while biomass has remained relatively steady.
Solar can be divided into three types: solar thermal, large-scale solar photovoltaic and small-scale solar. Generation from solar thermal sources has remained relatively flat in recent years, but solar photovoltaic systems experienced consistent growth.
Graphic courtesy of EIA
Nuclear future depends on natural gas prices, carbon policies
Relatively low natural gas prices, increasing electricity generation from renewable energy sources and limited growth in electric power demand contribute to increasingly competitive market conditions for U.S. nuclear power generating plants.
Sixty nuclear power plants operate in the U.S. with a combined electricity generating capacity of 99 gigawatts (GW). By 2025, nine plants with a combined 11 GW of capacity will retire. The EIA expects additional unplanned retirements will reduce total U.S. nuclear generating capacity from 99 GW in 2017 to 79 GW by 2050.
