Demystifying the pressure gauge spec sheet
There is no such thing as an exciting product specification sheet. Filled with rows of numbers and figures and formatting that switches between manufacturers, it is no wonder why a spec sheet makes informed decisions difficult. Under actual operating conditions, it is easy to be unsure of a pressure device”s performance and accuracy.
One central challenge is that no industry rules govern how pressure gauge manufacturers write their product specs and data sheets. Some companies advertise their performance under specific, controlled conditions. Others bury their actual figures inside dense spreadsheets and complicated formulas. And sometimes, important numbers are not published at all.
This article outlines how to cut through the confusion and read a specification sheet to determine the real-world accuracy of a pressure measurement device.
Accuracy statement
An accuracy statement defines the accuracy for a device. Several conditions must be met for the device to operate at this published specification. These restrictions are not always clearly disclosed and include:
- Stability over time
- Pressure range
- Compensated temperature range
An accuracy statement must include all potential effects of linearity, hysteresis, repeatability, temperature, and stability. If any of these are missing, they must be included for an overall assessment of the device.
Stability over time
Every pressure device allows some measurement drift over time. A key design requirement is to limit the amount of drift for a specific period after calibration. This period is called the Stability Over Time — the interval for which the gauge maintains the accuracy specified in the Accuracy Statement. An easy way to inflate a product”s performance is to shorten this interval, or refrain from publishing it, thereby obscuring the accuracy degradation that occurs over time. Products should be re-calibrated at the end of this interval. While shorter periods and more frequent calibration may be acceptable for some applications, repeated calibrations should be factored into the total cost of ownership. In cases where the Stability Over Time is not part of the Accuracy Statement, asking the manufacturer about the “one-year accuracy” of a device will provide a basis for comparison to other devices.
Pressure range
Inside the operating pressure range, the device retains its stated accuracy. Outside this range — either higher or lower — readings have an unknown error. Operating a device outside its pressure range can also lead to gauge damage.
Some devices warn users against taking readings outside the pressure range, with a flashing display or a blinking indicator. In extreme cases, where damage occurs, the gauge prevents the user from taking a reading at all.
In other devices, sensor damage is not apparent. These products continue reporting incorrect readings without any warning. This is especially common in analog gauges, which are sensitive to overpressure and have no self-diagnostics to check for damage.
Some products with piezo-resistive silicon sensors can handle extreme overpressure several times greater than their maximum rating. This feature is important if the potential exists for water hammer or other extreme overpressure conditions.
Compensated temperature range
Some products specify a narrow compensated temperature range, but make allowance for a wider operating tempreature range. This distinction is important because the compensated range indicates the temperatures between which the device corrects for temperature changes.
Many devices report excellent performance in a narrow band around room temperature, with a small adder for every degree of temperature outside that band. While this adder may seem insignificant, it can quickly overwhelm the basic specification at common working temperatures most users are likely to experience. An example of a compensated temperature range could be as follows.
- Basic Accuracy: ±0.1 percent full scale
- Compensated Temperature Range: 18 C to 28 C
- Temperature Adder: ±0.005 percent full scale per °C outside the compensated range
Correcting accuracy for temperature effects
This sample calculation demonstrates how to find the accuracy at a certain temperature: 40 C (104 F) outside the compensated range.
Example:
- The specification for a gauge is ±0.1 percent of Full Scale from 18 C to 28 C, plus ±0.005 percent of Full Scale per °C below 18 C or above 28 C.
- Measurements occur at 40 C, so: 40 C – 28 C = 12 C outside compensated range.
- The additional error is 12 C x ±0.005 percent per C = ±0.06 percent.
- The accuracy at 40 C is = ±0.16 percent of Full Scale, 60% percent higher than inside the compensated range.
% of Full Scale vs. % of Reading
Pressure measurement devices are commonly specified as percent of full scale or percent of reading, and the difference is significant. If an accuracy statement simply names a percentage (e.g., 0.1 percent), it is normally specifying a percent of full scale device.
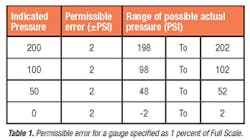
Percent of Full Scale: A 200 PSI gauge specified as 1 percent of full scale is accurate to within ±2 PSI, at any point from zero to 200 PSI.
Example:
- 200 PSI x ±1 percent = ±2 PSI
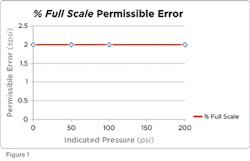
When this gauge indicates 100 PSI, the actual pressure may be as low as 98 PSI, or as high as 102 PSI. In fact, as shown in Table 1 and Figure 1, at zero PSI this gauge could indicate +2 PSI or -2 PSI and still meet the specification.
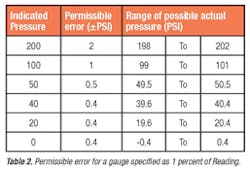
Percent of Reading: Another 200 PSI gauge, specified as 1 percent of reading works differently. The error for this gauge will be ±1 percent of the reading currently indicated on its display. At full scale, when the gauge indicates 200 PSI, the error would be ±2 PSI. As before, the actual pressure may be as low as 198 PSI or as high as 202 PSI.
Example:
- 200 PSI x ±1 percent = ±2 PSI
When the gauge indicates 100 PSI, the error improves to ±1 PSI. When the gauge indicates 50 PSI, the error improves to ±0.5 PSI.
Example:
- 100 PSI x ±1 percent = ±1 PSI
- 50 PSI x ±1 percent = ±0.5 PSI
It is important to notice that the accuracy cannot continue improving all the way to zero — there is a limit to how well the gauge can perform. Accuracy cannot be better than the smallest digit the gauge can display.
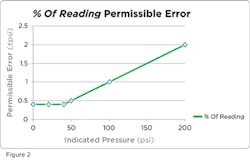
Gauges specified as percent of reading may address this issue by switching to a lower percent of full-scale rating at the lower end of their pressure range — for example around 20 percent, as shown in Table 2 and Figure 2.
Example:
- 20 percent of 200 PSI = 40 PSI
- Error at 40 PSI x ±1 percent = ±0.4 PSI
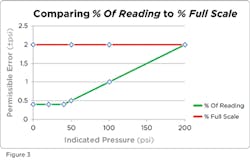
Figure 3 compares the error for a 1 percent of reading gauge and a 1 percent of full scale gauge. Full scale pressure is the only point where a gauge rated with percent of reading has the same accuracy as a percent of full scale gauge. At any pressure less than full scale, measurements on the percent of reading gauge have a lower error than the full scale gauge.
Factory calibrationThe original factory calibration documents how the gauge was operating when it left the factory. The quality of this calibration varies widely between products. The best will include measurements at several pressures and temperatures, documented by an NIST-traceable certificate.
Resolution, sensitivity & displayed units
There are two issues related to resolution, which may diminish the accuracy a gauge actually performs with.
First, the last displayed digit — called the least significant digit — may not change in increments of one on some gauges. It may change in increment by 2s, 3s, or even 5s. This occurs due to inadequate sensitivity of the analog to digital converter, and is especially noticeable in finely decremented units — such as millimeters of mercury or on metric scales like kPa.
Second, the resolution of the gauge must be adequate to display the accuracy of the gauge. For example, if a certain gauge claims an accuracy of ±0.02 PSI, then the gauge display must also have a sufficient number of digits to show changes of ±0.02 PSI. If the gauge lacks the resolution to display the advertised accuracy, the user should reduce the accuracy to match the resolution of the device.
Vacuum
Some gauge specifications cover vacuum and positive pressure. These gauges are commonly called compound gauges. When a compound gauge is specified in percent of full scale, it is very important to know what the full scale is.
A compound gauge may have a maximum operating pressure of 100 PSI, but if the accuracy statement includes vacuum readings, the full scale may include the vacuum range. Since full vacuum is approximately -15 PSIG, a 100 PSI compound gauge may have a combined full scale of about 115 PSI. Error readings based on this combined full scale value would be 15 percent worse than the user would expect.
A wide variety of issues exist related to the performance and accuracy of a pressure gauge. Above all, the most important consideration is to match the specifications of the gauge to its intended application. Installing a gauge with inadequate accuracy leads to flawed measurement data, while installing a gauge with excessively high accuracy increases the cost to purchase, calibrate, and maintain that gauge. While manufacturers usually make pertinent information available, the burden remains on the user to make educated decisions on their required accuracy and the devices they use.
Tom Halaczkiewicz was the president and founder of Crystal Engineering Corporation. He passed away on August 27, 2011, while hiking in the mountains of San Luis Obispo, California. A graduate of California Polytechnic State University, Halaczkiewicz designed and manufactured silicon pressure-sensor-based calibrators and gauges since the early 1980s. Some of his designs are, or have been, used on NASA Space Shuttle flights, the International Space Station, and by top racecar teams.
Patrick Klima is the technical writer at Crystal Engineering. After majoring in Mechanical Engineering at California Polytechnic State University, he wrote technical material and articles for a variety of industries, including energy management and green construction. His articles on pressure measurement have been published in a variety of trade magazines, including a previous appearance in Flow Control magazine. He can be reached at [email protected] or 800-444-1850.
