Reducing costs through digitization and condition-based monitoring
The ability to access and transfer data from digital (and analog) devices across multiple platforms has delivered advances in facility operation and data analytics. In addition, the financial and operational benefits of real-time prediction soon after data becomes available has motivated industrial sectors to progress towards replacing time-based calibrations with condition-based calibrations. This requires a full understanding of associated infrastructure and the relevance of the data before one can expect to fully realize the cost-saving potential of such practices.
The employment of advanced data analytics in different industrial sectors has reformed the way data is utilized. In recent years, companies have invested heavily in improving their knowledge of both the collected and on-line data they produce. In data analytics, both historical and real-time data can be analyzed to uncover complex patterns and trends in instrumentation which is related back to physical processes and events. Unforeseen downtimes, caused by machine breakdown, can result in an overwhelmingly heavy loss of revenue. Therefore, regular maintenance and health and viability monitoring of machinery is a standard procedure in industrial sectors.
Standard maintenance procedures comprise of regular cleaning, inspection, lubrication, repairing and replacement of pieces of equipment. Moreover, maintenance may be preventive or predictive. The major difference between preventive and predictive maintenance is that the latter is a continuous process based on the current condition of equipment, whereas the former is conducted at planned intervals based on the lifetime of a component of equipment.
Condition-based monitoring
The source of the data is specific to the processes, but the objective for all remains the same — to use statistical modelling techniques to develop a toolset that eventually predicts performance based on live and historical data — known as condition-based monitoring (CBM).
CBM is the process of observing varying parameters in equipment, such as temperature, pressure or even more device-specific digital diagnostic values, which might be correlated to specific industrial conditions. These conditions may be indicative of a known fault or an unknown condition. The time associated with failure diagnosis during scheduled maintenances is also minimized as a digital network allows for remote examination. Consequently, CBM allows old machines and infrastructure to be operational for a longer period which, in turn, leads to the extension of remaining useful life (RUL).
CBM enables real-time analysis of fluid conditions while quantifying the uncertainty of predicted outcomes, and therefore gives deep insights into the status of operational systems. This may also include anomaly detection or highlighting potential problems in the system before equipment is damaged.
The oil and gas industry, and more specifically the field of flow measurement, continue to implement these examples in scenarios that make use of data automation and maintenance decision-making. A better understanding of the data also leads to a more efficient decision-making process (either automated or human) in areas such as production optimization and custody transfer scenarios.
Greater insight
Continuing research and development of an analytical data-driven platform will increase end-user confidence in understanding the digital data collected in a static or dynamic structure. With the focus on supplying diagnostic data in the data-driven pipeline, it is believed that the data-driven approaches will support CBM, optimized maintenance schedules, faster decision-making and cost reduction for facility operation.
TÜV SÜD National Engineering Laboratory has recently completed research, which explains the correlations between process effects, meter condition and diagnostic data response. This will deliver greater insight to end-users on facility and meter performance — which is not currently available in the industry. For example, the research currently being undertaken at our UK flow facilities, as part of the UK Government-funded Flow Program, are furthering the understanding of diagnostic data response from a specific Coriolis meter installed within these facilities.
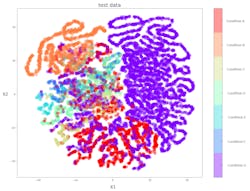
The figure below illustrates how a data-driven model can predict and classify different conditions within the range of variables X1 and X2 in a 2-dimensional parameter space. The range of parameter values appear in the axes of the scatter plot, and the model output (conditions) is plotted against these axes, to explain how the different location of the parameter space can estimate different classes of conditions in the model. For instance, condition G is well-distinguished from other conditions by the model, whereas, there is a strong class overlap between the conditions C, D, E and F. Therefore, we might need additional parameters (or samples) to help the model better classify those conditions.
Through an optimization process, a search algorithm is employed to explore the parameter space and find those sets of parameter values which are optimal. This is usually done by minimizing a misfit (loss function) between the model's predicted values and their true values. The search algorithm draws samples from the entire parameter space and evaluates the model behavior in the selected set of parameter values.
As in the above example, developing analytical tools to understand the historical trends hidden within the data to monitor the current condition and performance of flow meters has reached a new range of CBM solutions, which are now available to the manufacturing industry.
For the oil and gas industry, the continued adoption of digital equipment has expanded the amount of data available from instruments such as flow meters, probes and sensors. As a result, the additional data provide information on the integrity or quality of the associated device and the process stream.
Furthermore, this data can be used to predict the state of the system, efficient maintenance times and calibration requirements, leading to reduced staff work and process shutdowns. The need for physical intervention due to equipment malfunction is also lowered, which in turn minimizes the risk of unwanted hydrocarbon release during a device repair or replacement.
This is not limited to the oil and gas industry. Sectors such as food manufacturing are undertaking “digitization” strategies with application-specific software solutions to support CBM facility operation and to build data-driven models. Data-driven models employed across industry not only predict the real-time state of the system and/or RUL but also place confidence upon the prediction. These models utilize condition indicators, variables extracted from sensor data or log data whose behavior varies as the system works in different modes. The industrial sectors use the information on lifetime data, revealing how long it took for similar instruments to degrade for a known range of condition indicators that identifies a failure. Following multiple tuning iterations, confidence in the data-driven pipeline can be reached and the facility can start to adopt an efficient and intelligent decision-making process.
However, when predictive information is produced, it must be validated by practitioners before key decisions are made on the data. Further consideration will also be required to determine and validate how the predictive models developed, as part of our research project, may be extrapolated to account for variables specific to third-party facilities and differing flow meter manufacturers.
In summary, it is clear that CBM is the path forward; we have many other research projects underway to help ensure device reliability, staff safety and reduced maintenance costs. While the equipment is in service, CBM provides real-time continuous monitoring of fluid conditions in different applications without interrupting any operations in the system; a real benefit for industry. Through data-driven modelling, a facility’s data can be used to replace inefficient ‘time-based’ calibration and maintenance schedules with CBM systems which can remotely determine facility process conditions, detect fraudulent activity in custody transfer scenarios and meter calibration drift without the need for unnecessary manual intervention which is costly and time consuming for operators.
Behzad Nobakht is a data scientist at TÜV SÜD National Engineering Laboratory. TÜV SÜD National Engineering Laboratory is a world-class provider of technical consultancy, research, testing and program management services. Part of the TÜV SÜD Group, the organization is also a global center of excellence for flow measurement and fluid flow systems and is the UK’s Designated Institute for Flow Measurement.
About the Author
Behzad Nobakht
Data Scientist at TÜV SÜD National Engineering Laboratory
Behzad Nobakht is a data scientist at TÜV SÜD National Engineering Laboratory. TÜV SÜD National Engineering Laboratory is a world-class provider of technical consultancy, research, testing and program management services. Part of the TÜV SÜD Group, the organization is also a global center of excellence for flow measurement and fluid flow systems and is the UK’s Designated Institute for Flow Measurement.


