Most people who are familiar with control valves have seen the formula for calculating the valve capacity (Cv) required to pass a given flow rate of water (or liquid of similar density):
This seems fairly straightforward until you ask yourself, what is the correct value of differential pressure to use?
A control valve’s pressure drop
The piping system exists to perform a useful function for the facility. It could be cooling a product stream, delivering an ingredient, refilling a tank or any of the hundreds of other functions. The operator or engineer, knowing the required function and range of loads of the system, usually can determine the minimum and maximum flow rates that are needed to perform this function. Alternatively, if a single design condition is known, a reasonable guess of the expected range of flows can provide a minimum and maximum flow value to use for valve sizing.
Nearly all the components of the piping system are fixed. These components include the pipe, fittings, filters or screens, isolation valves and heat exchangers. The pressure loss in each of these components varies with the flow rate of the fluid passing through it. Once the process engineer determines the minimum and maximum flow rates, the pressure losses in these fixed components can be calculated for each flow rate.
Notice the word nearly is used above. That is because the one component not fixed is the control valve. The control system will adjust the control valve as needed for the system to deliver the flow rate required to perform its designed function. The portion of the overall system differential pressure not consumed by the fixed components in the system must appear across the control valve.
Making the calculations
There is a procedure for making the calculations that determine what the differential pressure (∆P) is for a control valve in a given system at specific flow rates. For each flow condition, one starts upstream of the valve at a place where the pressure is known. A good example of this type of location would be a centrifugal pump where the pressure can be determined from the head curve. From this spot in the system, subtract the pressure loss of each element. Proceed along the path of the system using the calculated pressure loss at the minimum flow rate for each elbow, isolation valve, heat exchanger and other fixed device, deducting each pressure loss.
Once this is done to the point of the valve inlet, the pressure of the system immediately upstream of the valve can be recorded as P1 at the minimum flow condition.
The next step is to calculate the pressure exiting the control valve, P2. This is done in a similar way to the first calculation, only in reverse. This means a spot downstream of the valve must be chosen where the pressure is known. A good example of this is a tank where the head is known. Another would be a point that the flow discharges to atmosphere. From this location, one needs to add the pressure losses until reaching the outlet of the valve. The reason that these numbers are added as opposed to subtracted like in the earlier example is because we are moving upstream in the piping rather than downstream. This result is recorded as P2 at the minimum flow condition.
With these two numbers recorded (P1 and P2), one can easily determine the pressure drop that must be accounted for by the control valve using the equation:
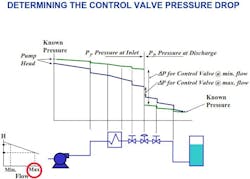
This procedure is repeated using values determined by the maximum flow rate. If the upstream known pressure location is a fixed-speed centrifugal pump, you will need to slide to the right on the pressure-flow curve to the delivered head value for the maximum flow rate, which will be lower than that for the minimum flow rate. The pressure loss of each fixed device will be greater at the maximum flow rate, so the slope of the graph of system pressure will be steeper than for the minimum flow rate condition. See Figure 1 for an example of the piping system pressure graph.
Once you have determined P1 for the maximum flow rate, start at the point downstream where pressure is known and work backwards, again using the higher values of pressure loss caused by the higher maximum flow rate. This will give you P2 for the maximum flow rate condition.
Understanding system pressure losses
As shown in Figure 1, in a typical piping system, the ∆P value for the minimum flow rate condition will be greater than the ∆P for the maximum flow rate condition.
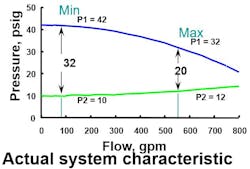
If you were to graph P1 and P2 for the full range of flows that the system is capable of supplying, you could produce a graph like the typical example shown in Figure 2.
The top line, showing the values of P1, will start at a relatively high value and decrease as flow increases. The lower line on the graph, the values of P2, will start at a relatively low value and increase as the flow increases. The distance between these two lines at any value of flow rate is the valve sizing differential pressure, ∆P. This graph is sometimes called the pressure curves. It can also be considered as a representation of the system characteristic — a summary of the properties of a specific piping system analogous to the inherent characteristic of a control valve.
Once the accurate values of P1, P2 and ∆P have been determined, making the (Cv) calculations and selecting a control valve can be easily and accurately accomplished.
Conclusion
The most important takeaway is that when sizing a control valve for a specific system, one cannot estimate or assume what the pressure drop is going to be. It must be calculated based on the nature of the system, taking into consideration all the fixed components in a given system and how that system will perform at both a minimum and maximum flow rate.
Peter Jessee, P.E., is a process control application engineer for Valin Corporation, a technical solutions provider for the technology, energy, life sciences, natural resources and transportation industries. Valin offers personalized order management, on-site field support, comprehensive training and applied expert engineering services utilizing automation, fluid management, precision measurement, process heating and filtration products. For more information, visit www.valin.com.
Peter Jessee
Peter Jessee, P.E., is a process control application engineer for Valin Corporation, a technical solutions provider for the technology, energy, life sciences, natural resources and transportation industries. Valin offers personalized order management, on-site field support, comprehensive training and applied expert engineering services utilizing automation, fluid management, precision measurement, process heating and filtration products. For more information, visit www.valin.com.


