Further elevating condition-based monitoring through data-driven modeling
Digitalization strategies are now commonplace throughout the manufacturing and engineering sectors. A major driver for this has been the fact that end users now have a wealth of diagnostic data available to them from digital transmitters. The data can be accessed in real time through OPC (Open Platform Communications) servers or stored in a database for future analysis. Through data-driven modeling, this data can be used to replace inefficient time-based calibration and maintenance schedules with condition-based monitoring (CBM) systems, which can remotely determine facility process conditions, instrument calibration validity and even measurement uncertainty without the need for unnecessary manual intervention, saving time and money for operators.
By measuring the real-time status of facility and calibration conditions, CBM is also capable of uncovering hidden trends and process value correlations, which were otherwise undetectable to standard human-based observations. The information generated through CBM can be used to predict component failure, detect calibration drift, reduce unscheduled downtime and ultimately provide a framework for in-situ device calibration and verification.
As such, many engineering consultancies now offer digital services in which they offer to build CBM systems based on a technique known as data-driven modeling. This enables the system to automatically flag anomalies and classify undesirable operating conditions to operators by using the time-series data output by the digital transmitters installed throughout the plant.
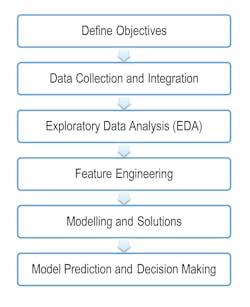
When specifying such a system with a consultancy, it is important to realize that there is no true one-size-fits-all solution. Every facility is different, from its mechanical build (e.g., pipe bends, valve positions) to its instrumentation (IO count, number of pressure/temperature sensors), not to mention the subtle variations in the digital data that can be obtained from differing manufacturers of the same instrument. Therefore, these models are not trained blindly, and the data scientists employed by such consultancies will work with the experienced on-site plant designers and operators to ensure that the outputs from these models align with the realities of the system and, most importantly, the subtleties of the customer’s engineering environment. A typical data science workflow at TÜV SÜD National Engineering Laboratory is shown in Figure 1.
It might seem obvious, but defining the objective(s) of the CBM system is a crucial first step, as this will inform which modeling techniques will be used and allow the data science team and customer to agree upon realistic milestones for the development of the system. For example, the evolution of the system may be split into three stages as the customer’s confidence in the system grows over time.
- Stage 1: Detect anomalies in the data streams, e.g. deviations from established baselines in all system process values and associated intercorrelations and flag to end user as a possible source of flow measurement error.
- Stage 2: Not only detect anomalies but also detect and classify specific fault conditions and flag to the end user, e.g., calibration drift in orifice plate’s static pressure sensor, misaligned Coriolis flowmeter at location X.
- Stage 3: Quantify the effects of this fault condition on the system’s overall measurement uncertainty with respect to measured mass flow rate.
A first-pass data collection and integration stage is then undertaken. At this point, multiple sources of data are standardized into a singular database, which the model will read from. This can sometimes be time-consuming as most plants were not necessarily designed with CBM in mind. As such, there may be three different data acquisition (DAQ) systems associated with three corresponding plant sub-systems, which in turn, log and store their data in three different file formats, with different labels and units.
The individual sources of data themselves can vary depending on the age of the system. For example, older systems are likely to contain legacy analog sensors. Such devices typically output a single signal, for example, 4-20 mA scaled over the measurement range of the device. More modern digital devices are equipped with fieldbus technology and, as such, are capable of outputting not only the primary measurement value from the sensor but also potentially hundreds of variables that can be used for diagnostic purposes to infer either the health of the device or even the wider system. The distinction between an analog and digital device can sometimes be masked in big datasets. However, when attempting to build an intelligent CBM system, it may be important to understand that a particular analog sensor is prone to electrical noise interference due to neighboring high voltage equipment. With this knowledge, a data scientist can tune the CBM to anticipate fluctuations in the analog signal from that sensor.
The storage of the data can also influence the type of modeling that can be performed. To put it simply, one can be faced with unlabeled or labeled data; unlabeled data has no supporting descriptions as to the processes or sensors that have generated the data. For example, there may be fluctuating trends in the data or sudden spikes with no indication as to the cause (provided either by the owner of the data or the automated system that generated the data). This scenario limits the data-driven modeling work to what is known as “unsupervised” learning, whereby the model will be able to learn the measurement system’s overall normal operating patterns and flag anomalies in the dataset for further investigation by experienced site engineers. This type of automated anomaly detection is still useful and potentially time-saving for plant owners, but it does not fully tap into the potential of data-driven modeling. Ideally, working with “labeled” data is the preferred scenario, whereby a data scientist has been presented with data where all sensors and signal type descriptors are present and all events within the data trends are highlighted with descriptions as to the individual causes. In reality, this information would likely be obtained through a working relationship between the data science team and the data owners over the course of the project and, in doing so, a “supervised” classification model can be built.
With the data standardized, exploratory data analysis (EDA) is then possible and this is the point where the data science team will seek to uncover patterns and correlations within the data and align them to real world occurrences with input from the experienced plant engineers and operators.
In order to train a data-driven model to detect certain conditions (e.g., normal state or error states), you must, of course, have examples of such conditions within your data. However, in a complex engineering environment with multiple variables in terms of physical processes and instruments, it is unlikely that a given error will present itself the same way in the data each time. For example, ambient temperature or flow rates may differ between instances. There may in fact be a very limited amount of data, which is representative of errors due to rarity of occurrence. Both of these scenarios effectively present a limited dataset to train a model from. To ensure a CBM model is reflective of real life, we require as many subtle variations in the logged parameters as possible. Ideally, we could create more “error” state data by physically simulating these states live in the field or within a laboratory, but this can be costly, especially if the error state is the erosion of components. As such, an alternative method of increasing the resolution of data is to generate “synthetic” data, which is artificially created by algorithms to mirror the statistical properties of the original “real” data. Synthetic data effectively increases the resolution of your CBM model training data and fills in the blanks required to make the model robust enough to handle variations from the limited field data it was trained on.
“Feature engineering” — as it is known in the data science community — is the process of ranking individual process variable importance with respect to the CBM detecting or predicting the events defined in the project objectives. This information can be incredibly empowering for end users before even getting to the complexities of machine learning. The number of variables output by digital transmitters can be difficult to correlate to process events by eye. Assigning meaning and importance to these variables, with respect to how specific conditions affect their trends, effectively provides end users with a map to better navigate variables that were previously meaningless.
After these initial steps have been completed, the model development can begin, which in itself is an iterative process, especially in scenarios where the system is to be developed using live data.
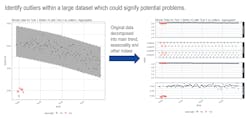
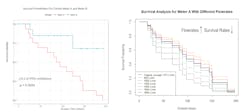
Figures 2 and 3 are examples of anomaly detection and failure analysis trend windows, which were designed by TÜV SÜD National Engineering Laboratory, to summarize the complex streams of information output by the CBM model in a format that provides actionable intelligence to end users without the need to be an expert in data science. Both windows were designed to meet specific customer requirements for data visualization.
As the name would suggest, the accuracy of data-driven modeling improves with the more data you feed it. This is where historical data can also play a vital part in the process, in combination with the previously mentioned synthetic data. Data scientists can use archived data dating back years from a given engineering plant to increase the model’s training dataset resolution and effectively backdate the model’s awareness of facility operation with information pertaining to previous faults and instrument calibration drift. The model will therefore be able to flag similar events should they occur again in the future.
Taking it one step further, by incorporating measurement uncertainty analysis into CBM, this improves predictive performance even when the live data departs from the initial training data. However, to date, little consideration has been given to uncertainty quantification over the prediction outputs of such models. It is vital that the uncertainties associated with this type of in-situ verification method are quantified and traceable to appropriate flow measurement national standards.
Therefore, research in this field is currently underway at TÜV SÜD National Engineering Laboratory, the U.K.’s Designated Institute for fluid flow and density measurement. By utilizing our flow loops to generate diagnostic datasets representative of field conditions, multiple CBM models can be trained by the in-house Digital Services team. In this controlled environment, every instrument’s measurement uncertainty is understood and accounted for in the CBM model. The end goal of CBM research is to obtain data-driven models that are highly generalizable and capable of interpreting live field datasets. By quantifying the uncertainty associated with model outcomes, this will create a National Standard for remote flowmeter calibration, with the knowledge and experience of current practices built in.
Where CBMs were maybe once seen as a novelty or “nice to have” in the eyes of end users, the need for cost saving and increased operational efficiency in industry has never been more prevalent. Successfully implemented and well-trained CBM systems can help operators realize these goals. For example, instead of an oil rig shutting down production to remove a flowmeter from a pipeline, box it up, ship it to a calibration lab, calibrate it and then re-ship and reinstall once a year (where there are considerable costs associated with each stage), a CBM system can simply tell you that based on the live and historical data, the meter performance has not drifted in two years and therefore production can continue. Or, if an operator observes that the flow rate readings have in fact started to deviate, a well-trained CBM system might be able to inform them that the problem does not lie with a drifting meter calibration; the deviation can instead be attributed to the erosion of the meter due to previously undetected particles in the flow and that immediate intervention is required to prevent permanent damage.
This early knowledge of a developing issue can save the operator thousands of dollars in replacement meter costs and manual fault diagnosis time. In summary, as more and more end users upgrade their plants to take advantage of digital instrumentation, the relevance and uptake of CBM models will continue to grow to the point where they are no longer a novelty but a necessity.
Dr. Gordon Lindsay is the head of Digital Services at TÜV SÜD National Engineering Laboratory. He is a chartered engineer with more than 13 years of experience in engineering design, build and commissioning. His specialist areas are control and instrumentation, digital networks, electronic engineering and DAQ software development within the fields of clean fuels, oil and gas and robotics. TÜV SÜD National Engineering Laboratory is a world-class provider of technical consultancy, research, testing and program management services. Part of the TÜV SÜD Group, it is also a global center of excellence for flow measurement and fluid flow systems and is the U.K.’s Designated Institute for Flow Measurement.
Gordon Lindsay
Dr. Gordon Lindsay is the head of Digital Services at TÜV SÜD National Engineering Laboratory. He is a chartered engineer with more than 13 years of experience in engineering design, build and commissioning. His specialist areas are control and instrumentation, digital networks, electronic engineering and DAQ software development within the fields of clean fuels, oil and gas and robotics. TÜV SÜD National Engineering Laboratory is a world-class provider of technical consultancy, research, testing and program management services. Part of the TÜV SÜD Group, it is also a global center of excellence for flow measurement and fluid flow systems and is the U.K.’s Designated Institute for Flow Measurement.


